Prepared by
Peter Kulakow
Great Plains/Rocky Mountain
Hazardous Substance Research Center
Kansas State University
785-532-7239 (voice)
785-532-6094 (fax)
kulakow@ksu.edu
TABLE OF CONTENTS
3.1 Matrix Description - Time 0 Sampling Results
5.1 Summary of First-Year Plant Growth at Sites A, B, and F
7.1 Regulatory Summaries for RTDF Sites
7.2 Use of the TPHCWG Method to Determine Risk Based Screening Levels
8.4 Phased Bioremediation/Phytoremediation
8.6 Interpretation of Analytical Data
Table 2-1. Summary of climate and site conditions for eleven RTDF trial locations
Table 2-2. Summary of the experimental design details for eleven RTDF sites
Table 3-1. Time 0 means and standard deviations for TPH by GC/FID for four RTDF sites
Table 3-2. Treatment mean concentrations of TPH, hopane, and hopane concentration expressed on an oil-weight basis for the Time 0 sampling of four RTDF locations
Table 3-3. Multiple comparison of treatment means for TPH, total priority PAHs, and benzo[a]pyrene equivalents for Site A - Time 0
Table 3-4. Multiple comparison of treatment means for TPH, total priority PAHs, and benzo[a]pyrene equivalents for Site B - Time 0
Table 3-5. Multiple comparison of treatment means for TPH, total priority PAHs, and benzo[a]pyrene equivalents for Site F - Time 0
Table 3-6. Multiple comparison of treatment means for TPH, total priority PAHs, and benzo[a]pyrene equivalents for Site G - Time 0
Table 3-7. Multiple comparison of treatment means for TPH, total priority PAHs, and benzo[a]pyrene equivalents for Site K - Time 0
Table 3-8. Summary of mean priority pollutant PAH concentrations at Time 0 for five RTDF field trial locations
Table 3-9. Summary of mean hopane concentrations, D2/P2 and D3/P3 source ratios, and D3/C3 weathering ratio for RTDF Time 0 data
Table 4-1. Status of field sites as of March 1, 2000
Table 5-1. Mean values for root weight, root length density, and aboveground biomass for RTDF Sites A, B, and F sampled at the end of the first growing season
Table 6-1. Recommended cost format
Table 6-2. Sample worksheet for compiling phytoremediation-specific unit costs over a three-year period - R&D application
Table 6-3. Sample worksheet for compiling phytoremediation-specific unit costs over a three-year period - full-scale application
Table 7-1. Carcinogenic PAHs for Site G at Time 0 and risk-based concentrations from EPA Region III RBCs
Table 7-2. TPH risk-based screening levels for Site G, Time 0
Appendix A. RTDF Phytoremediation Action Team Field Study Protocol, July 1999
Appendix B. Weather Summaries
Appendix C. Basis for Plant Materials Selection in Plant-Mediated Bioremediation at Petroleum Contaminated Sites
Appendix D. Suggestions for a Phased Approach to Bioremediation at Petroleum Contaminated Sites
ANNUAL REPORT OF THE RTDF
PHYTOREMEDIATION ACTION TEAM- TPH SUBGROUP
COOPERATIVE FIELD TRIALS
March 2000
The TPH Subgroup of the RTDF Phytoremediation Action Team has initiated cooperative trials to test the use of vegetation to enhance treatment of surface soils contaminated with weathered petroleum hydrocarbons. Collaborators include PERF (Petroleum Environmental Research Forum), USEPA, DOD, major petroleum and energy corporations, environmental consultants, and university participants. Nine of the trials have been planted, with the remaining two scheduled to begin in spring 2000. This report summarizes initial conditions from five locations where laboratory analytical results are available.
A standard experimental protocol specifies common procedures for each trial. Three vegetation treatments are to be compared in a randomized complete block experimental design with four replications. Treatments include 1) a standard cool-season grass/legume mixture composed of a combination of fescue, ryegrass, and a legume; 2) a locally optimized treatment that may include native species and trees; and 3) an unplanted, unfertilized control. Each trial will be monitored for a minimum of three growing seasons, with soil sampling to be done at planting and at the end of each growing season. Soils are to be sampled at two depths, 0-15 cm and 15-45 cm or depths appropriate to local site conditions. Soil samples are to be sent to a contracting laboratory and analyzed for total petroleum hydrocarbons (TPH), polynuclear aromatic hydrocarbons (PAHs), biomarkers, and hydrocarbon fractions estimated by the TPH Criteria Working Group method.
The 11 locations, referred to as Sites A through K, represent a range of climates, petroleum contamination situations, and regulatory issues. Three sites are located at present or former oil refineries. Two sites are at former manufactured gas plants. Four locations represent refined product spill situations; one location is an oil production site; and one involves sediments collected from a motor vehicle maintenance facility. The hydrocarbons from all of the sites are highly weathered. Since each trial is managed and financed separately with different goals and constraints, experimental designs vary at each site. Due to adherence to the standard protocol, there is sufficient commonality among the trials to consider them a comparable group. We hope to compare phytoremediation across sites with different hydrocarbon compositions, climates, and soil conditions.
Sampling time at the time of establishment of each trial is called Time 0. Site A had the highest mean TPH concentrations at 45000 mg/kg for the shallow layer and 57000 mg/kg for the deep layer. Sites B and G had mean concentrations of 12000 to 15000 mg/kg for both layers. Site F had the lowest TPH concentration with a mean of 1400 mg/kg in the shallow layer and 600 mg/kg in the deep layer. The sites vary in PAH concentration as indicated by the total of the priority pollutant PAHs. Site G had the lowest PAH concentrations and Site K had the highest. Sites F and K are both former manufactured gas plant sites and would be expected to have relatively high PAH concentrations because coal tar is the primary contaminant source at these locations.
Based on EPA guidance, the carcinogenic potential of PAHs was summarized in terms of benzo[a]pyrene equivalents, a weighted sum of the seven carcinogenic PAHs. Site K had the highest B[a]P equivalents of all sites with a mean of 72 mg/kg at the shallow depth and 138 mg/kg at the second depth. Site G was the only site with B[a]P equivalents less than 1.0 mg/kg at both the shallow and deep layers.
One of the purposes of this first-year evaluation is to determine if planted treatments survived at each site. Aboveground biomass production and root growth were estimated at three of the RTDF sites at the end of the first growing season. Aboveground biomass at Site A was higher than at Sites B and F, although root growth was less than other sites. Aboveground biomass production at Site B was low, reflecting drought conditions during the growing season.
Two cost spreadsheets have been prepared for entering costs over a three-year period to estimate both research and development (R&D) and full-scale application costs for implementing phytoremediation. RTDF field site managers will prepare cost estimation worksheets for each site. Based on these worksheets, phytoremediation cost estimates will be developed for use by all RTDF trial participants.
A primary purpose of the RTDF trials is to collect data that will help site managers and regulatory officials evaluate the potential of phytoremediation. In this report, we summarize some of the regulatory issues that were raised in obtaining approvals to conduct the trials. For Site G, hydrocarbon fraction data from the TPH Criteria Working Group method was used to illustrate calculation of risk-based, site-specific cleanup levels that are protective of human health and the environment.
RTDF TPH subgroup participants have considered many issues in developing the experimental protocol and establishing the trials. Some of these issues are summarized, including determination of appropriate fertilization practices, mowing practices, selection of plant species, integration of phytoremediation with other remediation technologies, microbial assessment techniques, and data interpretation issues.
This annual report summarizes the experimental procedures and initial conditions at 11 trial locations that will be monitored for three growing seasons. Future reports will analyze the influence of vegetation treatments on changes in TPH and PAH concentrations and hydrocarbon composition.
1.1 Introduction
The TPH Subgroup of the RTDF Phytoremediation Action Team has initiated a collaborative trial to test the use of vegetation to enhance treatment of surface soils contaminated with weathered petroleum hydrocarbons. Collaborators include PERF (Petroleum Environmental Research Forum), USEPA, DOD, major petroleum and energy corporations, environmental consultants, and university participants. Petroleum hydrocarbon contaminated soils are highly variable in composition and in the physical and chemical characteristics of the soils. The TPH Subgroup has been meeting since March 1998 to develop a standard protocol for conducting cooperative field trials. Features of the protocol specify common procedures for each trial covering vegetation treatments, experimental design, analytical parameters, analytical laboratories, and data analysis. As of March 2000, eleven locations have been entered into the RTDF program. Although each trial has unique features, there is enough commonality to the experimental design at each location to enable comparison of the results. Nine of the trials have been planted with the remaining two scheduled to begin in spring 2000. This report will summarize initial conditions for the five locations where analytical data were available.
The purpose of these cooperative trials is to test the efficacy of vegetation for enhancing degradation of weathered petroleum hydrocarbon contaminated soils in a range of locations. This document summarizes first-year progress of the trials, highlighting the status of the field sites, first-year plant growth, summaries of Time 0 hydrocarbon concentrations, and discussion of lessons learned. This annual report also serves as a repository for the data from the trials, making the data available to RTDF subgroup participants. The format of this report was guided by the cost and performance analysis format developed by the Federal Remediation Technologies Roundtable (USEPA, 1998).
Phytoremediation is the name for a set of emerging environmental cleanup technologies that use vegetation to enhance the dissipation or stabilization of environmental contaminants. Numerous mechanisms and applications of phytoremediation have been proposed and studied (Cunningham et al., 1996; Davis et al., 1998; Frick, Farrell, and Germida, 1999; USEPA, 1999). To treat petroleum hydrocarbon contaminated soils, the main effect of vegetation is hypothesized to be enhanced biological breakdown of hydrocarbons by increased microbial activity (Banks et al., 1999). Standard operating procedures and decision support tools are being developed to facilitate assessment and implementation of phytoremediation (CWRT, 1999; ITRC, 1999). There is a critical need to develop a database documenting the performance of phytoremediation in the field. This information is needed to determine potential opportunities and limitations of phytoremediation applications, and to provide documentation needed for its acceptance by the regulatory community. Initial field studies have shown that phytoremediation of petroleum- contaminated soils is promising (Banks et al., 1999).
A standardized protocol was developed to guide participation in the RTDF field trial. The complete protocol is presented in Appendix A. The protocol was developed with the objective to determine the efficacy of agricultural and non-crop plants for degradation of aged petroleum hydrocarbons in soil at multiple locations and under varied climatic conditions. The protocol specifies a standard experimental design for use at the participating RTDF sites. Although individual RTDF site plans vary from the protocol, there are enough common features to permit comparison of results from different locations.
The protocol specifies the following general features: Three vegetation treatments are to be compared in a randomized complete block experimental design with four replications. The treatments include 1) a standard cool-season grass/legume mixture composed of a combination of fescue, ryegrass, and a legume; 2) a locally optimized treatment that may include grasses or species mixtures, including trees; and 3) an unplanted and unfertilized control. The standard mixture may vary at each site, but the dominant species are intended to be cool-season grasses. This should produce a comparable vegetation structure at each location. The locally optimized treatment at many locations either emphasizes use of native species or trees. Unplanted treatments are to be kept free of vegetation, using either glyphosate or an equivalent post- emergence herbicide, hand weeding, or tilling. The unplanted treatment should not be fertilized. After extensive discussion of the fertilization issue, it was decided that the priority control treatment should simulate a minimal treatment situation. It was recognized that effects of fertilizer and vegetation would be confounded under this treatment scheme, but there are practical benefits for comparing vegetation with fertilization versus no vegetation without fertilization.
Each trial will be monitored for a minimum of three growing seasons with soil sampling to be done at planting and at the end of each growing season. Soils are to be sampled at two depths, 0-15 cm and 15-45 cm. Each soil sample is to be a composite of 8 randomly sampled cores per plot. The soil samples are to be sent to a contracting laboratory and analyzed for total petroleum hydrocarbons (TPH), polynuclear aromatic hydrocarbons (PAHs), biomarkers, and petroleum fractions estimated by the TPH Criteria Working Group method. A few soil samples are also to be analyzed for agronomic conditions, including soil nutrient status. On an annual basis, the trials are also to be assessed for plant species composition and plant growth to document the success of revegetation procedures.
2.1.1 Location, Climate, and Petroleum Contaminant Source
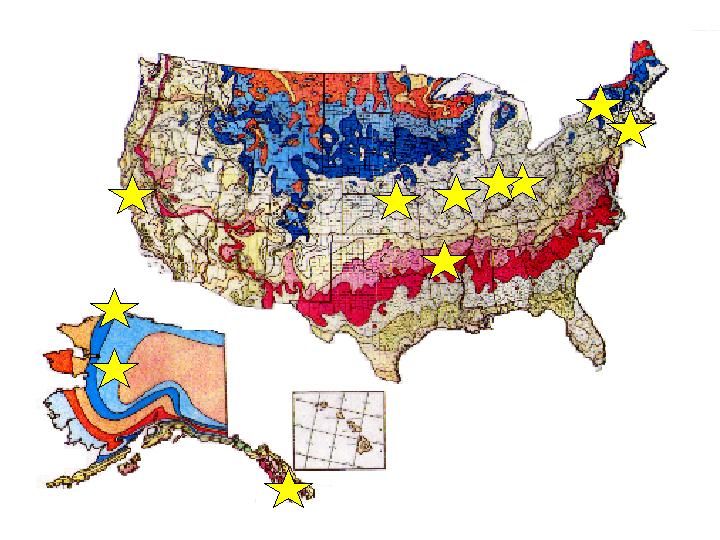
Eleven sites have been entered in the RTDF trial (Figure 1). These eleven locations represent a range of climates, petroleum contamination situations, and regulatory issues. Table 2-1 summarizes the climate and contamination situation at each of the sites. In this document, trial locations will be referred to by letters A through K. The sources of petroleum hydrocarbon contamination vary. Three sites are located at present or former oil refineries. Two sites are at former manufactured gas plants. Four locations represent refined product spill situations; one location is an oil production site; and one involves sediments collected from waste collected at a motor vehicle maintenance facility. Hydrocarbons from all of the sites are highly weathered. Growing conditions and climates of the experiment locations are also highly variable (Table 2-1). Appendix B presents additional climate information summarized on a monthly basis for data collected at a weather station near each site. This includes average temperature, average minimum and maximum temperatures, and rainfall.
.
Figure 1. Approximate locations for eleven entries in the RTDF TPH Subgroup phytoremediation trial.
The RTDF protocol (Appendix A) describes guidelines used to design trials at each location. Table 2-2 summarizes treatments, experimental design, sampling, and management procedures used at each location. Nine of the eleven trials have been started. The final two locations are expected to begin in spring 2000. Sites C, D, E, and K were initially planned prior to development of the RTDF protocol. Although experimental designs and sampling methods used for these sites are somewhat different than the other sites, their adherence to the standard protocol is sufficient to consider them as comparable to the other RTDF sites.
2.1.2.1 Treatments
All of the sites include at least one vegetated treatment and an unvegetated treatment. All of the sites, except Site K, include the standard cool-season grass mixture. Site K includes the standard mix of cool-season grasses as a cover under the single-vegetation treatment with poplar trees. Locally selected treatments vary among the locations. Three sites include poplar or willow trees, with Site B also having a hackberry treatment. Two sites include warm-season grasses and one includes a native cool-season grass mixture. Unvegetated plots are kept free of vegetation by use of the herbicide glyphosate, hand weeding, or no weed management. All of the unvegetated treatments are not fertilized. Site F plans to use no fertilizer. Sites C, D, and E also include a fertilized unvegetated treatment. All sites have used a randomized block statistical design except Sites C, D, and E. Sites C, D, and E include both vegetation and fertilization as treatments and use factorial designs. All sites have four replications, except Site K with nine replications.
2.1.2.2
Soil Sampling
The RTDF protocol specifies soils to be sampled at two depths, 0-15 cm and 15-45 cm. Three sites (A, G, and J) follow this guideline (Table 2-2). Others have site-specific considerations that suggested other sampling depths. Site B and Site K sampled to a greater depth than 45 cm and included a third sampling depth. Sites C, D, and E have shallow soils and used adjusted sampling depths. At Site F, a layer of more highly contaminated soil was applied on top of a base soil. Sampling depths of 0 - 20 cm and 20 - 40 cm at this site include samples in each of these layers. All soil samples are taken as composites of multiple cores in each experimental unit. The number of cores used to form the composites varies from 3 to 9 at different locations.
2.1.2.3 Laboratory Analysis
All sites are utilizing one of two contracting laboratories, Arthur D. Little or Battelle, for analysis of petroleum hydrocarbons. Use of common laboratories is one of the most important cooperative aspects of the RTDF trial that enables comparison of results from each location. The two laboratories use similar analytical protocols. A standard sample from Site A was prepared for inclusion with each set of samples to aid in comparison of analyses that were run at different times and by different laboratories. QA/QC measures have been taken to monitor data quality. These will not be summarized in this report.
Analyses of petroleum hydrocarbons include the following procedures:
2.1.2.4 Data Analysis
The primary purpose of these trials is to monitor changes in total petroleum hydrocarbons and polynuclear aromatic hydrocarbons to determine if vegetation treatment systems enhance degradation of weathered hydrocarbons compared to no treatment. The laboratory analytical protocol results in estimates of over 65 parameters for each soil sample. The primary statistical method that will be used to analyze these differences is analysis of variance. There are multiple sources of variability in the soil samples and field trials that contribute to experimental error and make it difficult to detect treatment differences. For this reason, we will monitor changes in individual compounds, hydrocarbon fractions, and data normalized by biomarkers to interpret results.
2.1.2.4.1 Biomarkers
When used to analyze petroleum hydrocarbon data, biomarkers are defined as relatively recalcitrant compounds that degrade at a much slower rate than other components of TPH. Biomarkers can be used to normalize highly variable parameters like TPH and individual compounds such as the PAHs (Douglas et al., 1994). Although it is necessary to determine the best biomarker to use for each location, hopane is a commonly used biomarker that we will use for initial analyses. Other biomarkers such as oleanane and norhopane also will be considered in future analyses. During the time of treatment, TPH and its component compounds are expected to degrade or decrease in concentration. As a recalcitrant compound, the concentration of a biomarker should not decrease with time. If biomarker concentration is expressed as a proportion of TPH, its concentration is expected to increase with the time of treatment. For example, if the hopane concentration is expressed in mg/kg on an oil weight basis, the dissipation of TPH can be estimated by the increase in the concentration of hopane expressed on an oil weight basis.
Concentrations of individual target compounds can be normalized using hopane or another biomarker. To normalize the data, the concentration of each target compound is divided by the corresponding hopane concentration of the sample. Normalized data can be analyzed by analysis of variance. A potential benefit of normalizing the data is to reduce the experimental error due to field variability among the soil samples. This can make it easier to detect treatment differences. Percentage changes in the normalized data from different sampling times can be used to estimate the change in hydrocarbon concentration with time.
2.1.2.4.2 Statistical Analysis
Since this report presents analytical results from the beginning of five trials, the most important use of the data is to identify starting concentrations for each trial and to determine appropriate procedures to use in future data analyses. Concentration data for all parameters presented in this report were corrected based on surrogate recovery percentages for appropriate surrogate spike compounds from each analysis. Data were summarized separately for each site by calculating the mean, standard deviation, coefficient of variation, and range for each grouping of parameters within a site. Grouping variables included soil depth, treatments, and replications. Analysis of variance was used to determine if there were significant treatment effects within each site. Treatment effects are not expected at the beginning of the trials. A least significant difference was computed to compare treatment means.
3.1 Matrix Description - Time 0 Sampling Results
This section presents a summary of analytical results for the five sites where data were available. Sampling time at the time of establishment of each trial is called Time 0. Time 0 sampling dates are listed in Table 2-2. Although some of the trials have been sampled at the end of the first growing season, this report presents only the Time 0 results to establish a baseline for comparing future results.
3.1.1 Total Petroleum Hydrocarbons
Table 3-1 summarizes the location mean concentrations for TPH by GC/FID for the four sites where Time 0 TPH data were available. Site A had the highest mean TPH concentrations at 45000 mg/kg for the shallow layer and 57000 mg/kg for the deep layer. Sites B and G had mean concentrations of 12000 to 15000 mg/kg for both layers. Site F had the lowest TPH concentration with a mean of 1400 mg/kg in the shallow layer and 600 mg/kg in the deep layer. Table 3-2 shows treatment mean concentrations presented at two sampling depths for each location. Analysis of variance, at most sites, did not indicate significant differences among treatment means at either depth. The only exception to this was at Site B where at the 15 - 75 cm depth, the willow treatment had higher analytical values than the unvegetated treatment. Time 0 treatment means for TPH are summarized in Tables 3-3 to 3-7.
Table 3-8 summarizes the priority pollutant PAH data for the five sites with Time 0 data. The sites vary in PAH concentration as indicated by the total of the priority pollutant PAHs. Site G has the lowest PAH concentrations and Site K has the highest. Sites F and K are both former manufactured gas plant sites and would be expected to have relatively high PAH concentrations because coal tar is the primary contaminant source at these locations.
Seven of the 16 priority-pollutant PAHs are considered to be probable carcinogens (USEPA, 1993). The total of these PAHs was summarized separately as total carcinogenic PAHs (Table 3-8). Another useful way to summarize the carcinogenic potential of PAHs is to express the carcinogenic PAHs in terms of benzo[a]pyrene equivalents. This term is a weighted sum of the seven carcinogenic PAHs based on the relative potency factors compared to benzo[a]pyrene (B[a]P) developed by EPA from analysis of toxicology data (USEPA, 1993). The PAH compounds and B[a]P relative potency factors are listed below:
|
Benzo[a]anthracene |
0.1 |
|
Benzo[a]pyrene |
1 |
|
Benzo[b]fluoranthene |
0.1 |
|
Benzo[k]fluoranthene |
0.01 |
|
Chrysene |
0.001 |
|
Dibenzo[a,h]anthracene |
1 |
|
Indeno[1,2,3-cd]pyrene |
0.1 |
The parameter B[a]P equivalents is calculated by multiplying each PAH by its relative potency factor and summing the result. B[a]P equivalents summarizes concentrations of potential carcinogenic PAHs in a single parameter. Benzo[a]pyrene and dibenzo[a,h]anthracene contribute more proportionally to this parameter than other PAHs. This parameter can be monitored at each sampling time to estimate changes in the carcinogenic PAHs. Site K had the highest B[a]P equivalents of all sites, with a mean of 72 mg/kg at the shallow depth and 138 mg/kg at the second depth. Site G was the only site with B[a]P equivalents less than 1.0 at both the shallow and deep layers. Time 0 treatment means for total priority pollutant PAHs and B[a]P equivalents are summarized in Tables 3-3 to 3-7.
3.1.3 Biomarkers, Weathering, and Source Ratios
3.1.3.1 Biomarkers
Hopane was chosen as the first biomarker to monitor in the RTDF trials. Table 3-2 summarizes the hopane concentration and the hopane concentration expressed on an oil weight basis for four locations at Time 0. These data can be used to monitor changes in TPH. Sites A, B, and G had mean hopane concentrations in the range of 2.5 to 11.4 mg/kg. Site F had much lower concentrations of less than 0.2 mg/kg, making use of the hopane biomarker more difficult. Initial inspection of the hopane data could suggest the amount of weathering and previous degradation each soil layer has experienced; however, it is important to carefully consider the situation at each location. For Sites A and G, the hopane concentration at both soil depths is similar when expressed on an oil weight basis. For these locations, changes in hopane expressed on an oil-weight basis may reflect changes in TPH as expected from analysis of biomarkers (Douglas et al., 1994). At Site A, however, the surface soil is more highly weathered than the base soil. If the two layers are starting the trial with similar hopane concentrations expressed on an oil weight basis, then the source material for the two layers may be different. The Site G soil is composed of freshly applied sediments so the shallow layer and the deep layer are expected to begin the trial from the same starting point. For Site B, the hopane concentration in the surface layer is higher than the deep layer, both in absolute concentration and as expressed on an oil-weight basis. This may indicate the surface layer is more highly weathered than the deep layer but it could also indicate different initial composition of the oil at the two layers. The hopane data will be most useful when comparing different sampling times within a site and soil sampling depth. At Site F, hopane concentrations are low and near the detection limits of the analytical method. This makes interpretation of the hopane data difficult. In addition, origins of the shallow and deep soil layers at Site F are different. The shallow layer was spread on top of the deep layer at Site F because the lower layer was already highly degraded. The top layer was expected to have more potential to show bioremediation treatment benefits. The relatively low concentration of hopane expressed on an oil weight basis in the shallow layer may indicate that it is less weathered than the deeper soil.
Use of the hopane biomarker to monitor changes in individual target compounds will be discussed in later reports when data from additional sampling times are available.
3.1.3.2 Weathering of Contaminants
Hydrocarbon contaminants at all RTDF trial sites have been subjected to weathering processes. Weathered petroleum hydrocarbons are likely to be less bioavailable for further degradation than for unweathered contaminants. The extent of weathering may predict the potential success of phytoremediation treatment. Several indicators are used to show the extent of weathering.
In weathered contaminated soil, the most readily degraded compounds are often in low concentration or are not detectable. This includes BTEX compounds (benzene, toluene, ethylbenzene, and xylene) and easily degraded PAHs like naphthalene. For most of the RTDF locations, BTEX was not directly estimated. The TPH Criteria Working Group method estimates the carbon number fractions that would contain BTEX compounds, and these fractions are all below detection limits for the sites where Time 0 data is available (data not shown). Another indication of weathering is the relatively low concentration of the unmodified two-ring PAH, naphthalene (Table 3-8).
As another indication of weathering, the alkylated forms of many PAHs may be in relatively high concentration compared to their unmodified parent compounds (data not shown). Douglas et al. (1996) showed that site-appropriate weathering ratios can be developed using alkylated PAH compounds with different degradation potentials. A useful weathering ratio must utilize PAH compounds that will be present in detectable concentrations over the course of the monitoring period. A low value of the weathering ratio indicates a more highly weathered sample than a higher value. One of these weathering ratios is D3/C3 or C3-dibenzothiophenes/C3-chrysenes. The D3/C3 weathering ratio for Sites A, B, and F are given in Table 3-9. For Sites A and B, the D3/C3 weathering ratios are lower in the surface soil (0.08) compared to the deeper layer (0.39 and 0.43). This indicates that the surface soil is more highly weathered than the deeper soil. At Site F, the surface soil has a higher weathering ratio than the deep soil. At this site, the surface layer was applied on top of the more weathered deep layer specifically because the trial managers wanted to test a soil with higher potential to benefit from phytoremediation treatment. The weathering ratio at Time 0 confirms this expectation. Over the course of the trials, it is expected that weathering ratios will decrease as an indication of further biodegradation.
Another method to look at the extent of weathering is to examine the proportion of TPH in GC chromatograms that can be resolved as individual compound peaks. As a petroleum hydrocarbon sample weathers, a higher proportion of the hydrocarbons will fall in the unresolved portion of the GC chromatograms.
3.1.3.3 Source Ratios
Douglas et al. (1996) also developed source ratios that might be useful for determining if the contaminant source from two soil layers is the same. Over the time of the trials, source ratios should not change while weathering ratios should change. Two potential source ratios are
D2/P2 - (C2-dibenzothiophenes/C2-phenanthrenes/anthracenes) and
D3/P3 - (C3-dibenzothiophenes/C2-phenanthrenes/anthracenes).
These ratios are summarized in Table 3-9. For Site A, there are differences in the source ratios from the shallow layer to the deep layer. This indicates that the two depths at Site A may come from different sources. Site F also showed a difference between the shallow and deep layers. This confirms the different origins of the source material at Site F where the shallow layer was spread on top of the deep layer. At Sites B and G, sources ratios for the two depths appear to be similar. Site G sediments were spread at the experimental site from one source prior to the trial.
Table 4-1 summarizes the status of the eleven field sites entered in the RTDF cooperative field trial. Although the protocol specifies sampling of the field sites at the end of each growing season, some sites have been sampled more than once in a year. Sampling times will be labeled with the number of the growing season of the trial followed by a letter if more than one sampling event has occurred during one growing season.
5.1 Summary of First-Year Plant Growth at Sites A, B, and F
Since phytoremediation depends on the interaction of vegetation and soil, documentation of plant growth is important to show the extent vegetation has grown at a site. Aboveground biomass production and root growth were estimated at three of the RTDF sites at the end of the first growing season.
Plant growth was estimated by sampling the aboveground biomass from two 0.5 x 0.5 meter quadrats in each plot. A soil core was taken within each quadrat to recover root samples at two depths, 0-15 cm and 15-30 cm. The aboveground biomass was dried and weighed to estimate biomass production. For each soil core, roots were separated from the soil, cleaned, and stained using a methyl violet stain. Stained roots were spread and scanned to obtain a digital image that was processed to estimate root length density. The stained roots were then dried and weighed.
Site A was planted on 12/3/98. First-year plant growth was sampled 4/23/99. All vegetated plots had good growth that covered the soil surface. The two vegetation treatments had similar amounts of plant growth (Table 5-1). The aboveground biomass at Site A was higher than at Sites B and F, although root growth was less than the other sites. Site A did not have remnant root growth from previous growing seasons because the surface soil that had vegetation growth prior to the phytoremediation trial was removed in preparing the trial. Root length density is a good measure of the extent of plant root development in a soil. Both treatments at Site A had similar rooting patterns. Most of the roots were in the top 15 cm of soil.
Site B was planted on 4/23/99. First-year plant growth was sampled 10/11/99. The location experienced below normal precipitation through the growing season that limited plant growth. Site B had three vegetation treatments, the standard grass/legume mixture, willow/poplar trees, and hackberry trees. Since the tree plantings had very limited growth, root and aboveground biomass was estimated only for grasses. The grass cover in one willow/poplar plot was sampled. One established patch of tall fescue on the site was sampled to estimate potential rooting of healthy established vegetation. The aboveground biomass production at Site B was low reflecting the poor moisture conditions (Table 5-1). In years prior to the trial, ryegrass had been seeded at Site B. Therefore root length density estimates included remnant root growth from previous growing seasons. Rooting was reduced with the depth of sampling, but a significant amount of roots were recovered at 15-30 cm. The established patch of tall fescue had very dense rooting to 30 cm, indicating that healthy, dense vegetation growth can be established at this location.
Site F was planted on 6/6/99. First-year plant growth was sampled on 10/7/99. Site F also had reduced precipitation through much of the growing season, although an irrigation system supplemented natural rainfall. Two vegetation treatments were sampled at Site F to estimate plant growth. The volunteer vegetation treatment was not sampled. The standard mix at Site F produced aboveground biomass that was in between the amount produced at Sites A and B. Root length density in the top 15 cm of soil of the standard mix plots was excellent, averaging 267 mm of roots per ml of soil. Since the top layer of soil at this site was moved on to the site, all of the root growth was produced during the current growing season. Prior to establishing the trial at Site F, the site had been heavily vegetated with naturalized vegetation. The remaining root systems from this naturalized vegetation were apparent in the samples from the 15 - 30 cm soil depth. Most of the roots at this depth were dead remnants from the old vegetation rather than new roots. Although some new tree roots were evident in the willow/poplar plots, the tree root systems were not well developed in the surface soil at the end of the first growing season.
Two cost spreadsheets were prepared for entering costs over a three-year period for both research and development (R&D) and full-scale application costs for implementing the RTDF phytoremediation of TPH protocols. The spreadsheets were adapted from an assessment of the cost and performance of a phytoremediation field trial at Craney Island, VA (Finn, 1999). The cost spreadsheets were derived from those presented in the U.S. EPA document Guide to Documenting and Managing Cost and Performance Information for Remediation Projects (USEPA, 1998). This document was prepared by member agencies of the Federal Remediation Technologies Roundtable (FRTR), and presents standardized cost spreadsheets to be used for calculating unit costs for individual technologies. The document can be downloaded from the Federal Remediation Technologies Roundtable Web site at www.frtr.gov.
The FRTR Guide presents the recommended cost format for the spreadsheets, with categories for estimating costs, as well as example items. This table and the resultant cost spreadsheets were modified to include example items specific to phytoremediation Tables 6-1 to 6-3. RTDF field trial site managers will prepare cost estimation worksheets for each site. Cost estimates will be summarized for use by participants in the TPH Subgroup.
To gain acceptance by the regulatory community, field data must demonstrate the effectiveness of phytoremediation under conditions that can be applied to potential full-scale treatment sites (Rock and Sayre, 1999). A primary purpose of the RTDF trials is to collect data that will be relevant to many potential cleanup sites. In addition, the interaction of RTDF site managers with regulatory officials can facilitate acceptance of the technology by addressing site-specific regulatory questions and concerns.
7.1 Regulatory Summaries for RTDF Sites
This section will summarize some of the interactions with regulatory agencies that site managers experienced in gaining approval to perform the RTDF trial at each location. The purpose of this summary is to illustrate the range of experiences at the different locations. This information may be useful for obtaining approvals for full-scale implementation of vegetation treatment systems in the future. The following paragraphs are short descriptions submitted by RTDF site managers.
|
Compounds |
Residential Standard |
Industrial Standard |
|
|
mg/kg |
mg/kg |
|
Diesel range organics |
200 |
500 |
|
Gasoline range organics |
100 |
100 |
|
Residual range organics |
200 |
500 |
|
Benzene |
0.1 |
1.4 |
|
Ethylbenzene |
20 |
230 |
|
Toluene |
40 |
520 |
|
Xylene |
20 |
320 |
|
Naphthalene |
30 |
30 |
|
Pyrene |
1,400 |
2,500 |
The TPHCWG has formulated an approach for developing risk-based screening levels (RBSLs) for TPH in soil that is protective of human health at petroleum hydrocarbon contaminated sites. The TPHCWG approach evaluates the risk to human health by examining fractions of the hydrocarbon contained in soils contaminated with TPH. These hydrocarbon fractions were selected to have similar fate and transport characteristics.
The TPHCWG approach to developing TPH RBSLs is a two-step process. The first step is to assess potential effects on human health from exposure to carcinogenic compounds in the soil [i.e., generally benzene or carcinogenic polycyclic aromatic hydrocarbons (PAHs)], since the presence of potential carcinogens typically drive cleanup efforts. If potential carcinogenic compounds are present above regulatory or risk-based levels, then these are used to develop cleanup levels. However, if potential carcinogenic compounds are not present, or are present below regulatory or risk-based levels, then the second step is to combine fate and transport information with noncarcinogenic reference doses developed by the TPHCWG to establish RBSLs for individual hydrocarbon fractions. The individual fraction RBSLs are then combined with site-specific mixture composition data to calculate mixture-specific "whole" TPH RBSLs. In this way, the TPHCWG approach evaluates a chemical mixture comprised of different carbon fractions instead of evaluating a single chemical, and the resulting whole TPH RBSL is the risk-based cleanup level.
The Time 0 TPH fraction data from Site G of the RTDF TPH Subgroup was used to determine a TPH RBSL for the site. This write up describes the process and results of that effort.
Step 1: Evaluation of Carcinogens
Surface and subsoil samples were analyzed for priority pollutant PAHs. Seven of these PAHs are potential carcinogens. Maximum concentrations of these carcinogens were compared to the risk-based concentrations (RBCs) listed in the EPA Region III Risk-Based Concentration Table (October, 1999). These RBCs are conservative, default values that have been determined to be protective of human health. Two types of RBCs are presented: RBCs for the ingestion of soil by a resident or commercial/industrial worker, and RBCs for tap water ingestion, where the ingested water is assumed to be groundwater that has been impacted by leaching of the contaminants from soil.
A comparison of the maximum concentrations of the carcinogenic PAHs to the RBCs is presented in Table 7-1. For the soil ingestion pathway, benzo(b)fluoranthene and benzo(a)pyrene concentrations in the surface and subsoil exceed the RBC for residential receptors. There are no exceedances for commercial/industrial workers. Assuming that this site will be used for industrial development after remediation (i.e., a deed restriction will prevent residential development), there is no potential adverse risk to future receptors directly exposed to soil at the site.
For the groundwater migration pathway, the maximum surface and subsoil benzo(b)fluoranthene concentrations (4.58 and 4.67 mg/kg, respectively) exceed the RBC (4.5 mg/kg) when a dilution attenuation factor (DAF) of 20 is applied (i.e., it is assumed that attenuation processes will reduce the concentrations of PAHs between the source-contaminated soil and the groundwater by a factor of 20). Assuming that groundwater beneath the site will not be allowed for use as production or drinking water, through a deed restriction, there is no potential adverse risk to future receptors exposed to groundwater directly beneath the source area of soil contamination. It is also assumed that, since the maximum concentrations are very close to the groundwater migration DAF, there will be no off-site migration of these compounds at concentrations exceeding the tap water RBC, and also that any contact to groundwater by construction/utility workers will be minimal due to a reduced time of exposure.
In summary, initial screening of soil carcinogens with default RBCs indicates that these compounds will most likely not pose an adverse risk to future commercial/industrial workers at the site.
Step 2: Development of a TPH RBSL
Since the carcinogenic compounds in the soil were determined not to be a concern for future commercial/industrial receptors, the TPHCWG method can be used to evaluate the noncarcinogenic risk by developing a TPH RBSL for soil. This step is divided into two stages. The first stage is to develop RBSLs for individual aliphatic and aromatic hydrocarbon fractions determined by the pentane extraction method recommended by the TPHCWG. Then, an iterative procedure is used to adjust the RBSLs so that the additive Hazard Index (HI) is 1.0. The sum of the RBSLs at this point is the TPH RBSL.
Standard equations for determining individual compound RBSLs from the ASTM Risk-Based Corrective Action (RBCA) guidance are used. The methodology for calculating a TPH RBSL is presented in Vorhees et al., 1999. It can be downloaded at: http://www.aehs.com/publications/catalog/contents/tph.htm.
TPH Criteria Working Group Approach Summary and Conclusions
Results of the TPHCWG method and standard TPH analyses (GC/FID, gravimetric, and aliphatic + aromatic fractions) for Site G are presented in Table 7-2. If a residential exposure scenario was assumed, the lowest TPH RBSL is for the soil ingestion pathway (6,864 mg/kg). If a commercial/industrial worker exposure scenario is assumed, the lowest RBSL is also for soil ingestion (10,163 mg/kg). The higher RBSL for the commercial/industrial receptor reflects a shorter exposure time and soil ingestion rate than for the residential receptor.
TPH analyses of the surface and subsoil exceed the TPH ingestion RBSLs for both residential and commercial/industrial receptors, indicating that the contaminated soil at this site may pose an adverse affect on these receptors under current site conditions. Therefore, this information may be used to determine a future course of action at the site to reduce or eliminate the risk, including 1) excavation and off-site disposal, or 2) remediation to decrease soil TPH concentrations.
RTDF TPH Subgroup participants have considered a large number of issues in developing the experimental protocol and establishing the phytoremediation trials. Many decisions and compromises had to be made to implement a simple and cost-effective study. Other issues have arisen in considering how best to analyze the field data considering issues of field variability, fluctuations in climate conditions, and consequences of treating highly weathered contaminants.
Some of these issues will be briefly discussed here to illustrate some of the discussions that have taken place and to aid in interpretation of the experimental results as the trials proceed.
Two main issues regarding fertilization were addressed during the protocol development, whether or not to fertilize the unvegetated control treatment and how much to fertilize. It was decided that the unvegetated control should not be fertilized because a primary objective of many of the RTDF participants is to compare vegetation treatments with minimal plot management. Many petroleum contaminated sites are maintained free of vegetation without added nutrients. Participants understand that the effects of fertilization and vegetation will be confounded in this experimental design. The optimal experimental design would include unvegetated control treatments that are fertilized and unfertilized in a factorial design. Sites C, D, and E have this type of design. The design for Site F excludes fertilization for all treatments.
Several considerations go into determining the proper rate of fertilization. Bioremediation treatment without vegetation uses various carbon, nitrogen, and phosphorus ratios to determine the appropriate level of nutrient additions. Plant growth creates added demands for nutrients as plants use nutrients in competition with microbial populations. If fertilization rates are determined based on the carbon content from analysis of contaminant concentrations, the recommended nutrient additions could be harmful to plant growth. RTDF participants decided that vegetation treatment plots should be fertilized at the rate of 50 to 1 carbon to nitrogen and 100 to 1 nitrogen to phosphorus. Applications of fertilizer should be spread over the time period of the trial to avoid over fertilization and damage to the plants. Fertilization rates would be increased to account for plant requirements for nutrients.
In many cases, plant-mediated bioremediation may not be nitrogen limited. In this case, the addition of nutrients may have little effect on the rate of degradation in a vegetation treatment system.
The effect of mowing on phytoremediation potential is not known. Regular clipping of vegetation likely would reduce root growth and lead to development of a more shallow rooting zone. It is not known if the stress on plant root systems caused by mowing would increase root exudation and encourage microbial activity, or if it would reduce the beneficial effects of vegetation by limiting root development. In situations where there is luxuriant growth of vegetation, including under high rates of fertilization, dense matting of vegetation can cause shading and reduce the health of the stand. Limited mowing has the advantage of reducing management operations. In the interest of establishing common management practices at the RTDF sites, it was decided to limit mowing of the experimental plots. Plots will be mowed only if necessary to maintain health of the vegetation stand and mowing will be limited to once during the dormant season.
Many criteria go into selection of plant species and genotypes for use in vegetation treatment systems. Attachment 1 of the RTDF protocol (Appendix A) summarizes some of these considerations. RTDF participants have continued to discuss how to select plant materials. Many of these issues are summarized in Appendix C. Frick, Farrell, and Germida (1999) reviewed plant species with demonstrated potential to remediate or tolerate petroleum hydrocarbons.
8.4 Phased Bioremediation/Phytoremediation
Integration of phytoremediation with other treatment technologies is another important issue in determining the most cost-effective treatment systems. Considering potential advantages and limitations of phytoremediation has led to the suggestion that a phased approach that includes conventional land treatment bioremediation, followed by establishment of vegetation treatment systems, will be a compelling option in many situations. This approach is summarized in Appendix D.
Assessments of microbial activity and microbial community structure are optional parts of the RTDF protocol. A summary of microbial analyses recommended for RTDF trial sites is included as Attachment 5 of the RTDF protocol (Appendix A). As of March 2000, no microbial assessment information is available from the RTDF field sites. Table 4-1 lists field sites where microbial analysis is planned or is being considered.
8.6 Interpretation of Analytical Data
Many issues have arisen concerning interpretation of the analytical data. A few of these issues are mentioned here. These considerations will be increasingly important as data is available from future sampling times.
8.6.1Correction of Data Based on Surrogate Spike Recovery Percentages
One QA/QC measure taken when analyzing each sample is the inclusion of surrogate spikes. Surrogate spikes can be used to track the efficiency of extraction and sample recovery for each analysis. Data quality objective for surrogate recovery percentage is between 45 and 125 percent. The data summaries submitted by the analytical laboratories report the analytical data without correction for differences in the percentage recovery of surrogate compounds. Within the range of acceptable surrogate recoveries, surrogate-corrected data values can be substantially different than the original values. Data presented in this report have been corrected for surrogate spike recovery percentage. If a particular surrogate recovery value was outside the acceptable data quality objective, the next closest surrogate compound was used to make the correction. One useful function of this correction is to increase the comparability of data from different sets of analyses.
8.6.2 Interpretation of TPH Fraction Data Estimated by the TPHCWG Method
Each soil sample in the RTDF trial is being analyzed using the TPH Criteria Working Group (TPHCWG) method. The procedure uses a pentane extraction to fractionate the hydrocarbons into 13 or more fractions based on equivalent carbon numbers. The primary purpose for developing this method has been to use the data on the hydrocarbon fraction concentrations to develop risk-based screening levels for TPH, based on site-specific risk assessment scenarios that use toxicity parameters specific to the hydrocarbon fractions (see Appendix A, Attachment 6; Weisman, 1998, Vorhees et al., 1999). Use of these data for developing risk-based screening levels is summarized above in section 7.2.
A second value of the TPH fraction data is to monitor changes in the proportions of hydrocarbon fractions during the time of treatment. If vegetative treatment is able to enhance the dissipation of TPH, it may act to change some hydrocarbon fractions more than others. Changes in the proportion of hydrocarbon fractions will be analyzed as data from future sampling times are available.
There is another issue to consider when estimates of TPH estimated by GC/FID (modified EPA method 8015) are compared with estimates of TPH estimated by the TPHCWG method. The TPHCWG values are usually considerably lower than the GC/FID values. This is due to pentane `being less a less efficient solvent for petroleum hydrocarbons than dichloromethane used in method 8015. It is necessary to assume that the hydrocarbon fraction proportions estimated by the TPHCWG method are applicable to TPH estimated by other methods. This issue will be considered in future data analysis.
Section 9 - Concluding Remarks
This report summarizes activities, data, and discussion of the RTDF Phytoremediation Action Team TPH Subgroup that took place during the first growing season of the cooperative field trials. It represents the first phase of analysis of the results of these field trials. It is an introduction to an effort to study the efficacy of vegetation to enhance the treatment of soils contaminated with weathered petroleum hydrocarbons.
Banks, M. K., A.P. Schwab, R.S. Govindaraju, and P. Kulakow. 1999. Field Demonstration. In: Phytoremediation of Hydrocarbon-Contaminated Soil. Fiorenza, S., C. L. Oubre, C. H. Ward (eds.) Lewis. Boca Raton. pp. 3-88.
Cunningham, S. D., T. A. Anderson, A. P. Schwab, and F. C. Hsu. 1996. Phytoremediation of soils contaminated with organic pollutants. Adv. Agron. 56:56-114.
CWRT. 1999. Guidelines for successful phytoremediation. J. Jordahl and T. Simpkin (eds). American Inst. of Chem. Eng/Center for Waste Reduction Technologies. Publ. No. C-11.
Davis, L. C., M. K. Banks, A. P. Schwab, M. Narayanan, and L. E. Erickson. 1998. Plant-based bioremediation. In Bioremediation: Principles and Practice Vol. 2. Biodegradation Technology Developments. S. K. Sikdar and R. L. Irvine (eds). Technomic Publishing Co. Lancaster, PA. pp. 183-217.
Douglas, G. S., A. E. Bence, R. C. Prince, S. J. McMillen, and E. L. Butler. 1996. Environmental stability of selected petroleum hydrocarbon source and weathering ratios. Env. Sci. and Tech. 7:2332-2339.
Douglas, G. S., R. C. Prince, E. L. Butler, and W. G. Steinhauer. 1994. The use of internal chemical indicators in petroleum and refined products to evaluate the extent of biodegradation. In Hydrocarbon Bioremediation. R. E. Hinchee, B. C. Alleman, R. E.
Hoeppel, and R. N. Miller (eds). Lewis. Boca Raton. pp. 219-236.
Finn, J. 1999. Technology design/evaluation. In: Phytoremediation of Hydrocarbon-Contaminated Soil. Fiorenza, S., C. L. Oubre, C. H. Ward (eds). Lewis. Boca Raton. pp. 89-158.
Frick, C. M., R. E. Farrell, and J. J. Germida. 1999. Assessment of phytoremediation as an in- situ technique for cleaning oil-contaminated sites. Petroleum Technology Alliance of Canada. Calgary. pp. 82.
ITRC Work Group. 1999. Phytoremediation decision tree. Interstate Technology Regulatory Cooperation. pp. 24.
Rock, S. A. and P. G. Sayre. 1999. Phytoremediation of hazardous wastes: potential regulatory acceptability. Env. Regulation and Permitting. Spring 1999:33-42.
USEPA. 1993. Provisional Guidance for Quantitative Risk Assessment of Polycyclic Aromatic Hydrocarbons. EPA Office of Research and Development. EPA/600/R-93/089.
USEPA. 1998. Guide to Documenting and Managing Cost and Performance Information for Remediation Projects. Federal Remediation Technologies Roundtable. EPA/542/B-98/007.
USEPA. 1999. Phytoremediation Resource Guide. EPA/52/B-99/003.
Vorhees, D. J., J. Gustafson, and W. Weisman. 1999. Total Petroleum Hydrocarbon Criteria Working Group. Volume 5. Human Health Risk-Based Evaluation of Petroleum Contaminated Sites: Implementing the Working Group Approach. Amherst Scientific Publishers. Amherst. pp. 98.
Weisman, W. H. 1998. Total petroleum hydrocarbon criteria working group: a risk-based approach for the management of total petroleum hydrocarbons in soil. J. Soil Contamination. 7:1-15.
Acknowledgements
Material contained in this report represents the joint effort of all participants in the RTDF Phytoremediation Action Team TPH Subgroup. Many individuals in the group contributed content and ideas to the production of this document. Steve Geiger prepared the cost estimation worksheets and the risk assessment for Site G. Thanks to Dr. Larry Erickson for review of the document and to Rita Shade for production assistance.
Disclaimer
Although the projects described in this report have been funded by the U.S. Environmental Protection Agency Technology Innovation Office under assistance agreement R825550 through the Great Plains/Rocky Mountain Hazardous Substance Research Center, the report has not been subjected to the agency's peer and administrative review and, therefore, may not reflect the views of the agency. No official endorsement should be inferred.